Module 5 Hydraulics Field Observations
- gavabe45
- Feb 13, 2021
- 1 min read
Updated: Feb 17, 2021
1. Location Map
The study site for the assignment was upstream of the Utah Water Research Laboratory bridge to the first bend. The site was visited on 2/10/21. In the provided interactive map the water flow direction is from East to West.
2. Field Map Sketch

Figure 1: Field Sketch of Study Reach
3. Oblique Photos of Channel

Figure 2: Convergent Flow due to Rock Structures in the Logan River.

Figure 3: Divergent Flow due to Rock Structures in the Logan River.

Figure 4: Uniform Flow as depicted by the uniform arrows in the Logan River.

Figure 5: Eddy Shear zone and Wake Shear Zone in the Logan River.
Flow Separations are depicted as the red circles, flow seams are the blue lines, and the reattachment zones are the green triangles.
The dominant flow type in this reach of river is riffle as seen in Figure 4.
4. Estimate Discharge
This portion of the river had an average velocity of approximately 1.0 m/s which was calculated by the Orange Peel Method. It took the orange peel approximately 5 seconds to travel 10 meters.
The average depth of the study reach was 0.5 m with a width of 7 m.
Cross sectional area = average depth * width = 0.5 m *7 m = 3.5 m^2
Discharge = area * velocity = 3.5 m^2 * 1.0 m^s = 3.5 m^3/s
5. Cross Section of Sketch
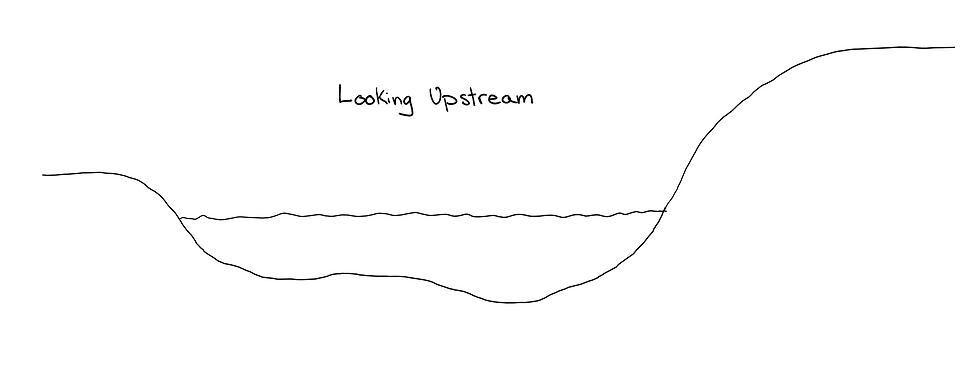
Figure 6: Cross-section Sketch of Study Site.
6. Hydraulic Jump Example

Figure 7: Hydraulic Jump diagram from the Logan River.


Comments